
How to become the richest person on earth (and learn some Go along the way)
Ok, to be frank, this article is mostly about the second part of the title. We will build a market simulation with minimal Go code, and show how the rich get richer even when they are not greedy at all.
Table of contents
Wealth inequality
A while ago, I came across an article in Spektrum der Wissenschaft, the German offshoot of Scientific American (here is a link to the original article in SA, where the author, Prof. Bruce M. Boghosian, describes an economic model of wealth distribution. The model is a fairly simple simulation of transactions between econcomic agents, and the mechanics of the model do not seem to be favoring richer agents in any way. In fact, the rules are built to be in favor of the poorer of the two agents who interact. Yet, in this model, money keeps flowing towards fewer and fewer agents who become richer and richer. At the end, most of the wealth is owned by a single agent or very few agents, and the large rest of the agents own almost nothing.
How can this be?
Enter market simulations: The Yard Sale model
An early explanation is the Yard Sale model, developed by Anirban Chakraborti (see Distributions of money in model markets of economy). The basic assumption is that a buyer never pays exactly what the good is worth. Sometimes, the buyer pays more, sometimes less than the real value of the traded good.
As an example, imagine that you visit a yard sale and discover a beautiful Yokutlix. Yokutlixes, as everyone knows, have an economic value of $147. After a lot of bargaining, the seller agrees to give it to you for only $122.
After the trade, your personal wealth got increased by $147 - $122, or $25, whereas the seller's wealth decreased by the same amount.
On the next yard sale, you happen to find a Robotized Luggage Inducer Widget that looks fairly used but still functioning, and as you wanted to have a Robotized Luggage Inducer Widget since you were a kid, you buy it instantly for $67. (And admit it: you would even have paid up to $97.50 for this, wouldn't you?) Now the true economic value of this not-quite-new-anymore Robotized Luggage Inducer Widget is only $50, so this time your wealth decreases by $17, and the seller's wealth increases accordingly.
Let's face it, you are not exceptionally skilled in bargaining, and with each of your trades, wealth seems to float randomly to or from you. But you knew this already, right?
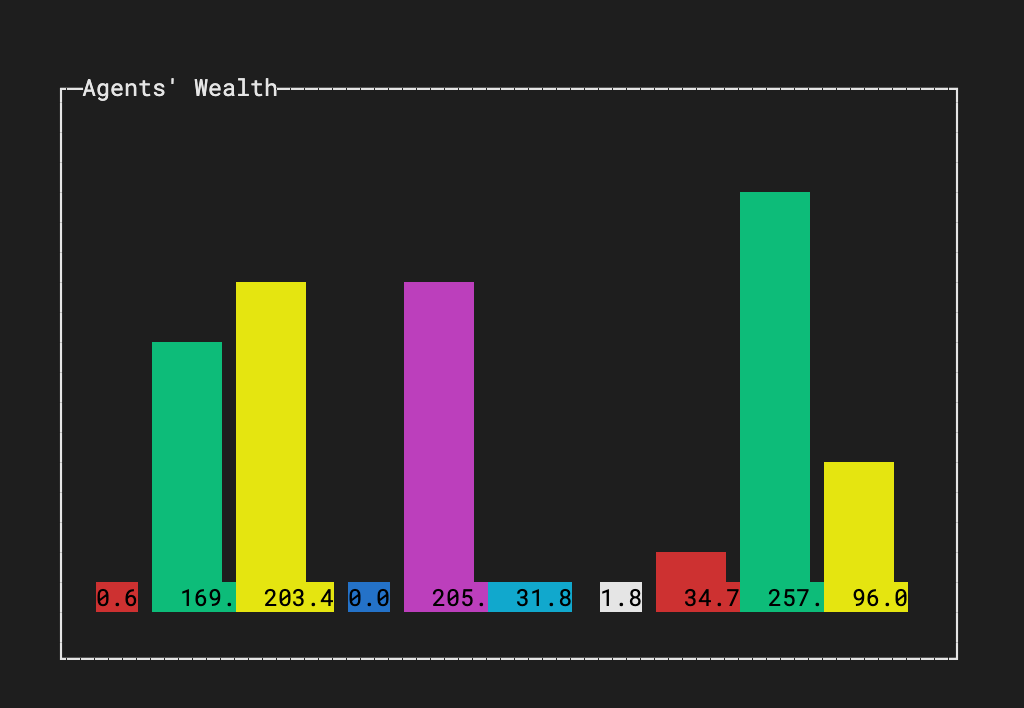
What if all people in a market were like you? If all people in a market have the same trading skills, wealth should remain more or less evenly distributed, like a white noise distribution perhaps.
In a Yard Salee simulation, however, even though all participants have the same probability of gaining or losing wealth in a transaction, wealth inevitably flows towards a few (or even a single person), leaving all others in poverty.
Again—how can this happen?
The Casino model
To answer this, let's have a closer look at Bruce M. Boghosian's model. I call it “Casino model” as Boghosian uses a casino metaphor to describe the nature of a transaction: A coin flip decides if an agent gains or loses wealth in a transaction. The setting is indeed very simple, a few rules are sufficient to describe the model. (Note: these are not exactly the same rules as in the article I referenced. There are a few similar models around, and I further adapted a few aspects for the sake of simpler coding, as we'll see later.)
- The simulation consists of a market with a fixed number of agents and a fixed amount of money.
- All agents start with the same amount of money.
- The simulations advances in rounds. At each round, two randomly selected agents get into a transaction.
- In each transaction, as the money paid for an item is never the same as the item's real value, wealth flows randomly from one agent to the other. (Determined by a coin flip, like in a casino bet.)
- The flow of wealth is always only a fraction
fof the wealth of the poorer of the two agents. - If wealth flows from the poorer to the richer agent,
fshall be smaller than in the opposite case, that is, when wealth flows towards the poorer agent. - No debt is allowed. Hence agents cannot lose more than they own.
Rule 6 is particularly interesting. This rule obviously gives the poorer agent an advantage. To explain this, let's set f to 20% if the poorer agent gains wealth, and to 17% if the poorer agent loses wealth. Sounds like a real adavantage for the poorer agent, right?
As we will see, even this advantage does not prevent wealth inequality.
The code
I strived to get along with the least amount of code to implement this simulation.
The agents of the market are just a slice of floats that represent each agent's wealth. I intentionally did not try to build some fancy autonomous actor models with structs and methods. And you may wonder if this is a good choice. After all, this is a simulation model, and thus it would just seem natural to design the actors in this simulation as autonomous entities with a well-defined behavior and an internal status. But just slices?!
Yes, just slices. I think it is important to avoid the trap of over-designing or over-architecting a solution. Think KISS – Keep It Simple, Stupid.
And, especially when you feel tempted to construct layers of abstractions because you think you need to generalize your solution so you can reuse it for similar problems in the future, it is likely that YAGNI – You Ain't Gonna Need It.
What do we need here?
We need a simulation loop that lets two agents make a trade and win or lose some wealth. This loop can be trivially broken further down into two parts.
First, we need to randomly pick two agents. Then, the two agents get into a trade, and one of them gains some worth while the other lose the same amount. Which of the two wins and which one loses is totally random. We could do a coin flip for that, as described in the Scientific American article. But wait, we already picked the two agents randomly. We can thus simply define that the one picked first is the one who loses wealth in the trade, while the other one is the one who gains wealth. One step less to take care about.
Then, the trade takes place. We need to determine which of the two agents is the poorer of the two, because the wealth moved between the agents depends on the poorer agent's wealth (rule #5), and on the advantage that is granted to the poorer agent (rule #6).
This is all it needs. Except that we still need to visualize the result! No good simulation without a visualization.
I could go for a graph library like gonum's plot package, and plot a wealth distribution histogram at the end of the simulation. But I really would prefer to see some live output while the simulation runs. And I want a package that is super easy to implement and does not inflate the code unnecessarily. I remembered the article about Text-Based User Interfaces that I wrote a while ago, and from the TUI packages I tested back then, I picked termui. It provides a bar chart widget out of the box and can be set up with a few lines of code.
But still, there is a slight complication to address. termui creates a temporary overlay on the terminal, similar to less. When the app ends, the UI vanishes, reverting the terminal back to its previous contents. However, I want to keep the bar chart visible after the simulation loop ends. termui takes control over keyboard events, so I cannot use the standard os.Signal approach to wait for Ctrl-C. Instead, I use termui’s PollEvents() function to read keyboard events and exit on any keypress. By passing the done channel also into the simulation loop, I can also interrupt the simulation by a key press if it runs for too long.
Ok, enough theory, here is the code:
package main

import (
	"fmt"
	"log"
	"math/rand"
	"time"

	ui "github.com/gizak/termui/v3"
	"github.com/gizak/termui/v3/widgets"
)

const (
numOfAgents = 10
initialWealth = 100.0
rounds = 10000
percentGain = 0.20
	percentLoss = 0.17
)
type agents []float64
sender and receiver between 0 and numOfAgents-1
and ensures that sender and receiver are not equal. (After all, agents would not trade with themselves.)
Note the use of named return values that saves an extra declaration of receiver outside the loop
(to avoid that receiver exists only in the scope of the loop).func pickTwoRandomAgents() (sender, receiver int) {
sender = rand.Intn(numOfAgents)
receiver = sender
receiver. Repeat until receiver != sender for receiver == sender {
receiver = rand.Intn(numOfAgents)
}
return sender, receiver
}
sender, receiver were already chosen randomly, we can decide at this point that agent sender always loses
wealth, and agent receiver always gains wealth in this transaction.
Note: the agentsfunc trade(a agents, sender, receiver int) {
receiver in this transaction.
The amount that flows from sender to receiver is always a given percentage of the poorer agent.receiver is the poorer agent, the gain is percentGain of receiver’s total wealth. transfer := a[receiver] * percentGain
sender is the poorer agent, the loss is percentLoss of sender’s total wealth. if a[sender] < a[receiver] {
transfer = a[sender] * percentLoss
}
	a[sender] -= transfer
	a[receiver] += transfer
}
func drawChart(a agents, bc *widgets.BarChart) {
	bc.Data = a
	maxPossibleWealth := initialWealth * numOfAgents
	currentMaxWealth, _ := ui.GetMaxFloat64FromSlice(a)
	bc.MaxVal = currentMaxWealth + (maxPossibleWealth-currentMaxWealth)*0.05
	ui.Render(bc)
}
func run(a agents, bc *widgets.BarChart, done <-chan struct{}) {
	for n := 0; n < rounds; n++ {
sender, receiver := pickTwoRandomAgents()
trade(a, sender, receiver)
drawChart(a, bc)
done.
The read shall not block, hence it is enclosed in a
select block with a default clause. select {
case <-done:
			return
		default:
		}
	}
}

func main() {
a := make(agents, numOfAgents)
	rand.Seed(time.Now().UnixNano())

	for i := range a {
		a[i] = initialWealth
	}
gizak/termui makes rendering a bar chart in a terminal super easy. err := ui.Init()
if err != nil {
log.Fatalln(err)
}
defer ui.Close()
bc := widgets.NewBarChart()
bc.Title = "Agents' Wealth"
bc.BarWidth = 5
bc.SetRect(5, 5, 10+(bc.BarWidth+1)*numOfAgents, 25)
bc.LabelStyles = []ui.Style{ui.NewStyle(ui.ColorBlue)}
bc.NumStyles = []ui.Style{ui.NewStyle(ui.ColorBlack)}
bc.NumFormatter = func(n float64) string {
return fmt.Sprintf("%3.1f", n)
}
ui.Render(bc)
termui has its own event polling.
We use this here to watch for a key press
to end the simulation done := make(chan struct{})
go func(done chan<- struct{}) {
for e := range ui.PollEvents() {
if e.Type == ui.KeyboardEvent {
				close(done)
				return
			}
		}
	}(done)
run(a, bc, done)
	<-done
}
How to get and run the code
To directly run the code, call
go install github.com/appliedgo/rich@latest
This command downloads the project into the module cache, compiles it, and places
a binary named rich into $(go env GOBIN) (or $(go env GOPATH)/bin if GOBIN is not set).
You can run the binary by calling rich at the shell prompt.
However, it is more fun to play with the code. To do this, clone the project to your disk and run it locally:
git clone https://github.com/appliedgo/rich
Then cd into the source code directory, get the dependencies, tweak the code as you like, and run it:
cd rich
go run rich.go
(If you get errors about missing dependencies, ensure your Go environment is in Go Modules mode and run go mod tidy or go mod download.)
Tweak the parameters like winning or losing percentage, the number of agents, or the initial wealth, and see how the results change.
As an extra challenge, change the bar chart to show the wealth distribution in buckets instead of individual agents. Then run the simulation with, say, 1,000 agents over 100,000 rounds.
Note that the code does not run in the Go Playground, due to the requirements of the termui package.
Lessons learned
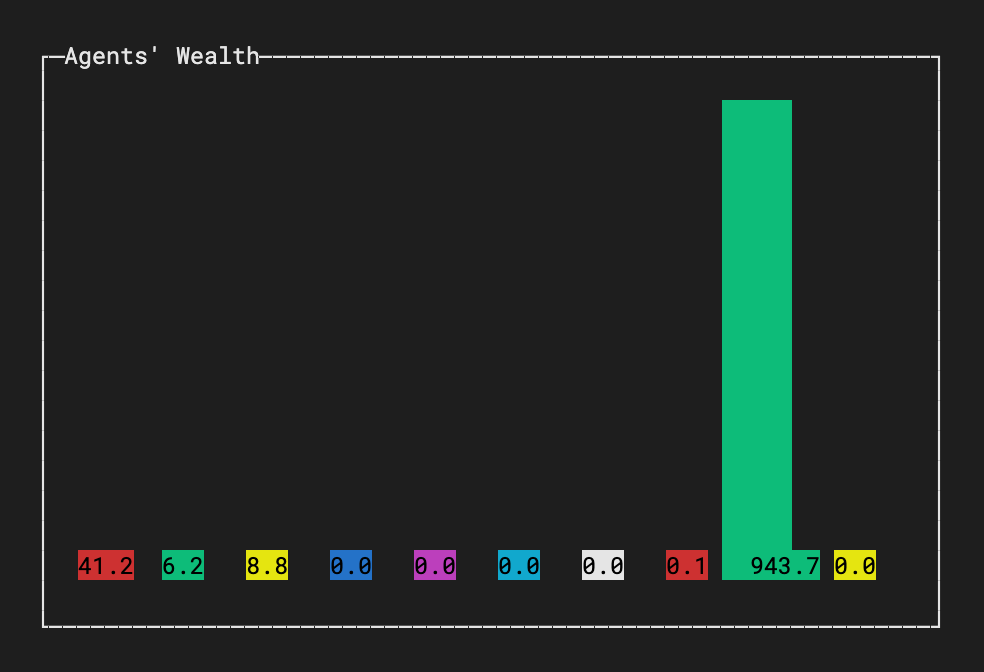
For politicians, economists, and all those who fight poverty:
With a few lines of code, we have shown that wealth always flows from the poor to the rich, no matter if everyone has the same trading skills. Some people just seem to be lucky and gain some wealth initially, which then makes it even easier to accumulate more wealth. Sure, the real world is much more complex and diverse. But simple as this model is, it shows that extreme wealth inequality can be caused by nothing but the basic mechanisms of a free market, even in the absence of greedy, evil-minded players.
For Gophers:
A little loop and a visualization package is all you need for writing simulations. Next time you come across an iterative model of reality, grab a UI/graph/plot package, write a loop and verify the hypothesis behind the model.
Happy coding!
Imports and globals